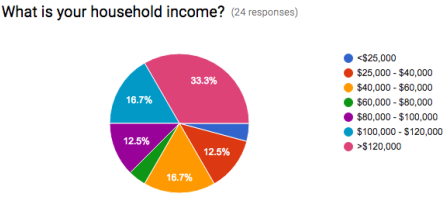
international urbanization
  • About
    • Support
  • News
  • Faculty
  • Projects
    • Autumn 2016 Projects >
      • City of Cupertino
      • Menlo Spark
      • Sustainable San Mateo County
    • Autumn 2015 Projects >
      • Beijing Hutong Neighborhoods
      • City of Cycles
      • Clean Air Campaign
    • Autumn 2014 Projects >
      • Bicycle Urbanism
      • Cultural Preservation
      • Electric Vehicles
      • Food Systems
      • Land Use
    • Spring 2014 Projects >
      • aWalk
      • BreatheChina
      • Green Cloud
      • Micro-Travel
      • Walk!Man
      • Wukong
    • Human City Workshop
  • Expo
    • 2016 Human Cities Expo
    • 2015 Human Cities Expo
    • 2014 Human Cities Expo
    • 2014 Urban Sustainability Expo
  • Apply
  • Blog

cost of living in san mateo county

It is well known that it is becoming more and more expensive to live in San Mateo County. For instance, the market average rent has risen 38.9% in the last four years for a 1-bedroom unit to $2,638 in June 2016.
​​
Our team worked with Sustainable San Mateo County on their 2017 Key Indicators Report on COST OF LIVING. We set out to gather personal stories and investigate how the high cost of living in San Mateo County has affected sustainability on the individual and household levels.

process

We interviewed 12 San Mateo County residents about the cost of living at the San Mateo Farmers’ Market held at the College of San Mateo and at Target in Redwood City, CA on Saturday October 22, 2016. We asked them a series of questions about themselves and the effect of cost of living in San Mateo County on their lives. (See “Survey Questions” in Downloads)

We created a Google Form to collect sample household budgets from San Mateo county residents to gain a better sense quantitatively how people are being affected by cost of living. We distributed this link via social media, talking to friends, and at the Rents Too High Protest in Redwood City on November 18, 2016. We collected a total of 24 household budgets.

We also set up a public interactive post-it note display in downtown Redwood City on November 25, 2016 to gather thoughts on factors that make San Mateo County expensive and effects on sustainability- which includes cultural, social, economic, and environmental factors. We gathered a total of 97 post-its.

findings

​Interviews

Picture
Location 1 (San Mateo Farmers' Market):
- more cohesive community  
   environment
- had more of a homogenous
​   white demographic
​- crowd was wealthier
Picture
Location 2 (Target, Redwood City):
- larger diversity in
   demographics of race and
​   age
- people were less social 
Picture
Overall oberservations:
- Renters feel much more burdened by the costs of housing than
​   homeowners paying a mortgage.

household budgets

We had a fairly diverse, in terms of socioeconomic background, set of people participate in our household budget survey. About 60% of our 24 responders rent in San Mateo County. The average amount of money our responders spend on housing (rent or mortgage- not including annual insurance/property taxes) per month is $2,121.17. The average savings our responders have per month is $593.48.
Picture
Picture

personal stories

​We barely make it.
We interviewed a 43 year old Latina woman at Target. She has a working husband and four kids. She works as a nanny and goes to school part-time. She and her husband need to pay for childcare/after school programs, food, sports, and housing. She estimates that her family of six spends 50% of their income on housing.
We're shopping more at Target than Nordstorms.
This interviewee estimates spending 70% of her income on rent. She is a 34 year old white woman working at a construction company and raising 2 children. She is in a difficult position because she thinks that she would not qualify for affordable housing either if that were an option. She hopes to move out of the area- to San Diego or out of state.

interactive post-it note board 

Picture
Here are some of the responses that our participants wrote:
Cultural:
  • Less diversity
  • ​Influx of diversity
  • Artists getting priced out
  • Lack of work/life balance
  • Even more crowded​
Economic:
  • Affects budget, less money for expenses (other than rent)
  • Affects taxes
  • Lot of job opportunities
Social:
  • Economic inequality
  • Gentrification
  • I can’t afford to stay here.
  • My children cannot afford to live here.
​
Environmental:
  • Loss of open space
  • Longer commutes, more CO2 emissions


​

Meet our team

Picture
LENA BLACKMON,
MATERIALS SCIENCE
Picture
MICHAELA CRUNKLETON,
​INTERNATIONAL RELATIONS
Picture
TRAN LAM,
​EARTH SYSTEMS
Picture
FLORA WANG,
​SYMBOLIC SYSTEMS

DOWNLOADS (coming soon)

Literature review
executive summary
household Budget data
  Program on Urban Studies  |  Civil & Environmental Engineering  |  Earth Systems Program  |  International Policy Studies